Fluorescence Spectroscopy Virtual Lab Simulation
Senior Capstone
Team Size: 5
Team Members: Khadijat Amoo, Paul Case, Bum Chan Koo, Priun Nagru, Tristan Rogers
Clients: Mary Peek, Dexter Dean, Rui Hu
GitHub Link: https://github.com/priunnagru/JID1353-fluorospectroscopy-lab
Preview Final Prototype
My Role: Lead UX Engineer
My Contribution
UX/UI Design:
Strategized end-to-end user flow on Figma.
Created interactive high-resolution assets from scratch using Adobe Illustrator.
Prototyped end-to-end user flow on Figma and created a sequence diagram to help my team members in development transfer the design to code.
Once deployed on Node.js, designs improved student’s retention by 38%.
User Research:
Attended and documented several fluorescence spectroscopy labs (in-person) to learn the lab on a scientific level.
Conducted user research with over 50 participants to understand the user's preference in error message design in correlation with their ability to retain information.
Developed over 30 user stories, scenarios, and a story map to simulate potential use cases.
User Testing:
Used A/B Testing to determine best methods for user education when first interacting with the virtual simulation.
UX Skills Applied
Tools: Figma, Illustrator
Prototyping + Wireframing
Vector Art Creation
User Scenarios
User Research (Observation, Interview, Surveys)
A/B Testing
Heuristic Evaluation
Table of Contents
Terminology
Introduction
System Architecture
Data Storage Design
Component Design
UI Design
Appendix A
Terminology
AntD: Extends functionality of React.js.
AOS: Library used to animate elements as you scroll the page.
Aphrodite: Framework-agnostic CSS-in-JS with support for server-side rendering, browser prefixing, and minimum CSS generation.
Babel.js: Converts ECMAScript 2015+ code into a backwards compatible version of Javascript used in current and older browsers.
Classnames: Simple Javascript utility for conditionally joining classNames together.
CSS: Language used to style an HTML Document.
Cuvette: Small container used to store a liquid.
Emotion.js: Javascript library used for writing css styles in Javascript.
Fluorescence: The amount of light emitted from excited electrons when a certain wavelength of light interacts with it.
HTML: Basic building block of web development, used to define the meaning and structure of web content.
JSON: Text based way to store Javascript objects, arrays, etc.
LottieFiles: Used for animations.
Material UI: API used to add additional customization features for UI elements found in React.js
Node.js: Javascript framework used to create web based applications.
React.js: API used to create interactive User interfaces.
rjsf: React component capable of building HTML forms out of a JSON Schema.
Sass: CSS preprocessor.
Storybook: Tool used for building UI components and pages in isolation.
Spectrofluorometer: A machine that uses strong lasers to measure the fluorescence of a chemical stored in a cuvette.
Swiper: Used to create mobile touch sliders with hardware accelerated transitions.
Web Vitals: A Library for measuring Web Vitals defined metrics on users.
Yarn: Allows users to download packages that can be used on a project.
Project Introduction
Rationale / Background
The Fluorescence Spectroscopy Lab Simulation is an online lab simulation that was created to simulate a very expensive biochemistry lab tool called the Spectrofluorometer. This lab tool allows individuals to gather information about an “unknown” molecule through a process called fluorescence spectroscopy; that is: a chemical process by which a beam of light excites the electrons in molecules of certain compounds and causes the molecule to emit light that can then be measured to identify the wavelength it produces. Normally the biochemistry students interact with this lab tool in person, but the students only have a small frame of time to use the equipment which typically leads to students gathering incorrect data. Students typically don’t know that their data is incorrect until it’s too late, thereby affecting their grades negatively. The creation of an online simulation could provide 24/7 hour access to this lab tool. It is also beneficial to simulate the spectrometer because it is a very expensive lab tool, so only a few machines on the Georgia Tech campus can facilitate this fluorescence spectroscopy process; therefore making the virtual lab a cheaper alternative.
Client Profile & Expectations
The clients we will be designing for are Dr. Mary Peek, Dean Dexter, and Vincent Spezzo at Georgia Tech. Our client wants the students to learn how to use the equipment by themselves, so we need to balance levels of teaching and guidance through the software. We plan to make a comprehensive tutorial guide that is optional to use throughout the lab simulation. This will be denoted by a book icon at the top right of the screen. Our primary focus is the user’s ease of use and learnability from the simulation.
Project requirements
We aim to produce a simulation of the spectrometer that exhibits all of the important interactive functions and features of a physical spectrometer so that students could replicate the lab in the same manner in both settings. The goal is to have very little variability in the procedural thought process when performing the lab in person and online. Especially for safety purposes when re-enacting an experiment in person. We plan to use inspiration from the physical lab section by attending a few sessions and engaging with the students to understand how they normally engage with the device. We also intend to constantly check in with our client to ensure that our designs are meeting their needs.
Detailed Design Summary
This document will be a detailed overview of the architecture and design of our project. The System Architecture Design section will include the static elements, or all the components involved in the virtual lab and how they are related to one another, in the form of a diagram. We will also include the dynamic elements, or control flow and interaction with the user and the system, through a Unified Modeling Language (UML) diagram. In the Data Storage Design Section, we will outline the javascript frameworks (i.e. Node, React, Babel, Emotion, etc.) we use in our online product and discuss how they work in conjunction with one another to create the product. The Component Design Detail section will include a deeper dive into the system's static and dynamic elements (including robustness diagrams), to help you better understand the system’s architecture. Lastly, the UI Design section will include wireframes, or an interactive prototype that will allow you to experience the product from the user’s perspective.
System Architecture
Introduction
The app has been created using the React framework. We have created both a static UML diagram and a dynamic system architecture diagram to better illustrate our structure of the lab. Although the lab will be primarily controlled through various different front end pages, we will need to get an output graph from a database to simulate the hardware. We will also need to have some accessibility settings that can be changed from the settings page, and these settings should be applied across the entire lab.
Our goal with the lab was to make it as user friendly as possible, so all of the following diagrams represent interactions or state changes that can be performed through a clear button press in the app.
Static UML Diagram
The static UML diagram (Figure 2.1) demonstrates the control flow through the virtual lab. The user will first start in the main menu screen and will have the option to go to either the tutorial, the simulation, or the settings. All pages will be able to access any other page. If the user goes to the tutorial, the tutorial will ask for graphs of spectrometer data, so the database will look it up and return the graphs to the tutorial UI. If the user enters the settings UI, the lab will collect the settings configuration from the user input and apply it to all of the other pages. If the user enters the simulation tab, the user will need to input various parameters, such as the chemical type, the ex bandwidth, the measurement mode, etc, and take that user input to search a database to find the correct output graph. The graph will be returned to the user for inspection.
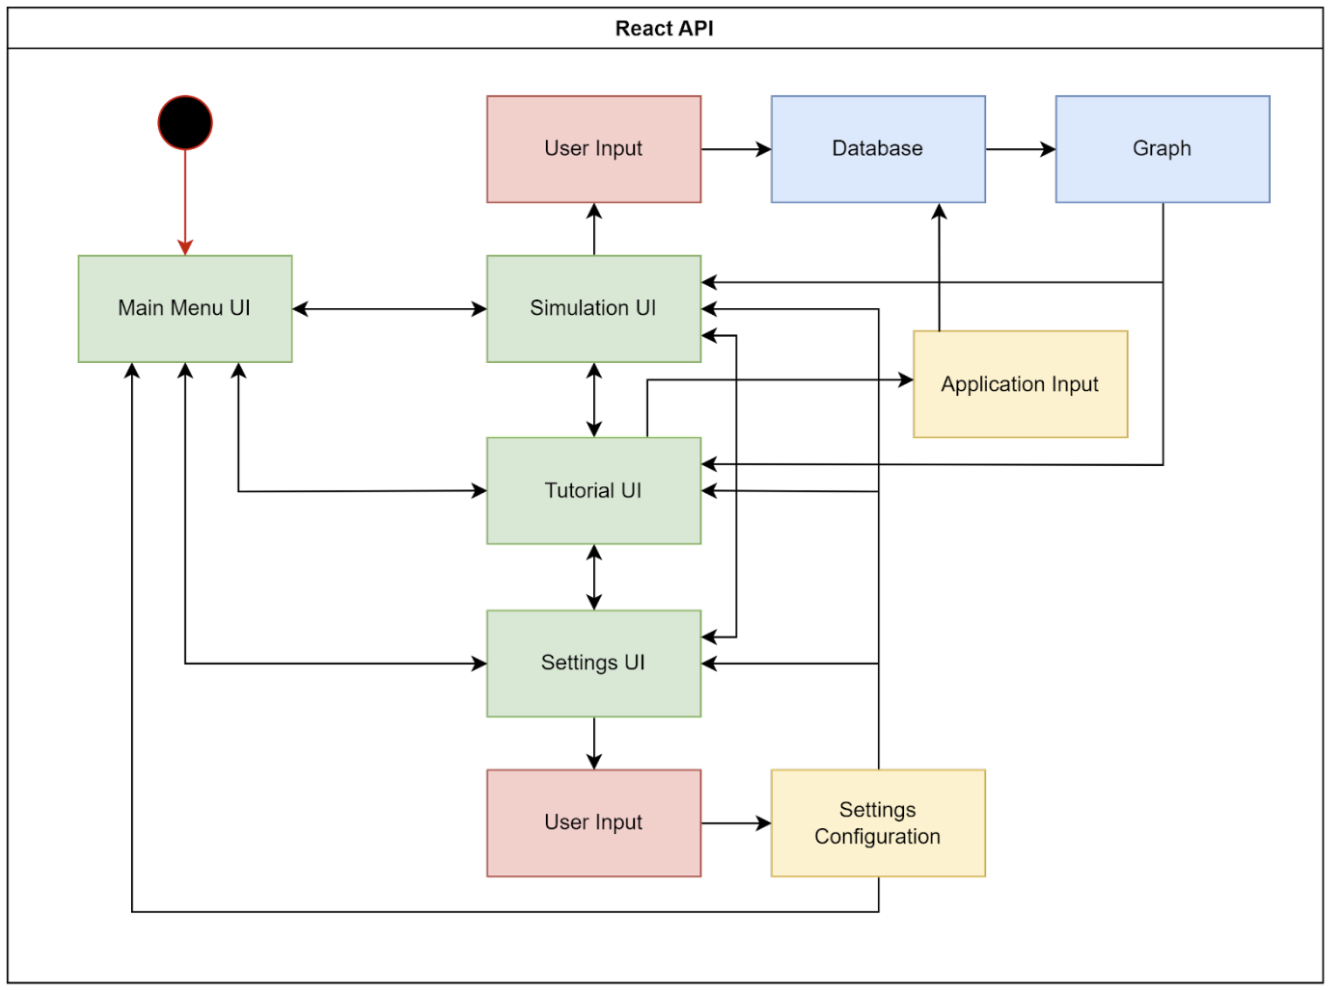
Figure 2.1: Static UMl Diagram showing UI interactions. Flows generally from left to right.
Dynamic System Architecture
The Dynamic System Architecture design graph shown below depicts several possible scenarios on how we expect our users to interact with our application during runtime. These scenarios include: Opening the application, running the tutorial, changing different settings, interacting with the virtual fluorometer, and extracting data from experiments; in that order. These are shown in Figure 2.2 to Figure 2.6.

Figure 2.2: Entering the Tutorial
The user will be greeted by the main menu, where they will be given the option to open the tutorial or the lab simulation. If the user chooses the tutorial, they will be taken through some informational slides and multiple choice questions.


Figure 2.3: Changing the Settings
This outlines how we plan on implementing the ability to change font sizes and color in the lab. We unfortunately did not have the time to implement this during our semester, so future teams will need to add this functionality.
Figure 2.4: Interacting with Fluorometer
The user chooses the lab simulation and will see a computer and a fluorometer. If they choose the fluorometer, they will be able to interact with it and put in chemicals.
Figure 2.5: Selecting a Cuvette
When the user selects a chemical, the cuvette will be placed in the receptacle, and the user will be required to close the hood before taking measurements.
Figure 2.6: Collecting Data
If the user chooses the monitor, they will be shown a computer screen with the software to record the data. They will be able to enter in certain parameters, and will click on the graph screen to be shown the collected data.
Data Storage Design
This subsection describes how the data is currently being stored.
All graphs are located in the /public/graphs folder, because the number of graphs is low in the current state. These are all .svg files with the filename “<hashCode>.svg”, and these are requested as needed during the simulation. The graphs were generated with a python script which is also provided in the codebase in “datagen.zip”.
Data will be stored on Firebase. The data for this project consists solely of image files, likely in .svg format. We will use Firebase Cloud Storage to store image files, and we will use a client-sided hashing table to pick which images to display to the user during the simulation. There will be no authorization required for this project. Additionally, as the data is collected by professors at GT, there are no security concerns and all data can be public.

Figure 3.1: Diagram of Application Mode and Data Storage interactions
In Figure 3.1, we show a generic diagram of how the web application will interact with the data storage system using Firebase.
Tutorial Mode (top of Figure 3.1)
The tutorial mode acts as a slideshow in the sense that each slide will request the same images from the database every time. Therefore, the tutorial will request the images from the database solely based on the current tutorial page number. Currently, the images are requested directly through their corresponding url.
Simulation Mode (Bottom of Figure 3.1)
The simulation mode will allow the user to pick from a list of parameters. We will then route these parameters into a client-sided hashing function that calculates a hash code for the specific set of parameters. We then append the hash code to a string, for example: “<hashCode>.svg”, at which point we request the corresponding image from the database to display when the user selects the “Graph” option.
Component Design
The class diagram below shows our static components of our virtual lab. Most of our work goes into the front end of the system, since no numbers are actually being calculated, but we do have a database in the back end that will be simulating the data collection of the fluorometer. The Buttons will facilitate the transport from one page to another, the fields will be storing important information, and functions will perform back end work with the database. The application will start in Manu.js, and will flow from left to right, top to bottom.

Figure 4.1: The Static Class Diagram
This robustness design depicts the user’s flow and options throughout the program. They essentially have three choices when they enter the main screen: select lab simulation, tutorial, or settings. The Dynamic Component Design Diagram is pictured in Figure 4.2 and is further broken down.
The Dynamic Component Design Diagram (Figure 4.2)

Figure 4.2: Dynamic Component Design
As shown in figure 4.3 below, one of the options the user has is to click the settings button. On this page, they will have the option to change the font size of the words and then adjust the audio settings. This will help make the simulation more accessible for the users. The adjustments are stored in the database.

Figure 4.3: Settings
The second option is to navigate to the tutorial page. This route is for users who want to learn more about fluorescence spectroscopy. This will occur through a series of questions. Upon view, they will be asked a question pertaining to the content of the lab and if their answer choice is correct, then they will get positive auditory feedback and a confirmation message and then the option to move on to the next page. However, if the answer is wrong, they will get a negative audio sound and a message noting that the answer is incorrect with a hint. Then they will press okay and try again. They will not be able to move on to the next question, until they answer correctly. See figure 4.4.


Figure 4.4: Tutorial
The last component of the dynamic design is the actual lab simulation itself. When the user clicks “start lab” the system will navigate to a lab setting where the user has the option to click either the spectrometer or the monitor. There are two components to the spectrometer: the spectrometer body (figure 4.5) and the spectrometer hood (figure 4.6). If the user clicks the body of the spectrometer, the screen shifts to a side view of the lab device giving them the option to toggle the on or off button. When turned on, the spectrometer hood option is activated and the user gets a better front view of the lab device with cuvettes on the side. They will be directed to the cuvette selection. If the user lifts the hood and clicks the cuvette, it will be placed inside the device. Information about the liquid in the cuvette is stored in the database. This action can be undone by selecting the cuvette while it is inside the hood so that it is removed.
Figure 4.5: Spectrometer Body

Figure 4.6: Spectrometer Hood
Lastly, the user can click the monitor (figure 4.7) where the actual graph or data that they want will be generated. If they select the computer, they will be prompted to the home screen of the monitor where they will have the option to click the Measure a Spectrum app. When selected, this app will have a top navigation option to set the parameters which includes: bandwidth, response time, wavelength, speed, etc. This is the intuitive part of the lab. Students need to enter in the parameters correctly to retrieve the data they want. They have two options: select “run” or select “clear”. Selecting “run” will trigger data collection from the database and output a graph for the student. Selecting “clear” will clear the parameters that they entered so that they may put in new parameters.

Figure 4.7: Monitor
UI Design
In this section we will present the User Interface (UI) of our application; as well as to elaborate on why our team decided to design our application the way it is.

Figure 5.1: Main Menu Screen
We give the user 3 options at the top level screen. The user can either choose to go into a tutorial that will teach them about the lab, Go into a lab simulation, or edit the settings. The user will always be able to access this page again from a home button on all pages.

Figure 5.2: Tutorial Quiz Question
The tutorial section will have a couple of slides explaining the content of this lab, as well as some quiz questions to test their understanding of the material. The page will only continue if the user selects the correct answers, but if an incorrect answer is selected, additional feedback will be provided to help clarify the question. The client wanted to add additional feedback to ensure that the user was learning the material.

Figure 5.3: Simulation Top Screen
Once the user selects the Lab simulation, they will be brought to a desktop with two possible options, the computer and the fluorometer. Clicking on each of these will bring the user to a new screen.

Figure 5.4: Fluorometer Front View
If the user clicks on the fluorometer, they will end up on this screen. The user will be able to view the top and side of the fluorometer and open the hood by pressing each of the respective buttons.

Figure 5.5: Fluorometer Side View (Deactivated)
When the user clicks the button that says ‘Side’ it brings us to the side of the fluorometer where the user is given the options to navigate to the top of the fluorometer or back to the front of the fluorometer and to toggle the fluorometer on or off. The fluorometer is initialized to be in a deactivated state; visually represented by the red button on the fluorometer.

Figure 5.6: Fluorometer Side View (Activated)
When the user clicks on the ‘Toggle Fluorometer’ button, the user can toggle the fluorometer on; indicated by the green button on the fluorometer. Likewise, if the user clicks on the ‘Toggle Fluorometer’ button again it will deactivate the fluorometer, returning to its previous state in Figure 5.5.

Figure 5.7: Fluorometer Top View
If the user clicks on the ‘Top’ button, the user will see this top down view of the fluorometer.

Figure 5.8: Fluorometer Top View (Chemical Menu)
If the user clicks on the ‘Chemicals’ button it will bring up this selection menu for different cuvettes containing a variety of different chemicals (The selection menu is currently a work in progress). When the user selects one of the cuvettes, a cuvette will appear inside of the fluorometer.

Figure 5.9: Fluorometer Top View (Cuvette)
When users select a chemical, a cuvette will appear inside of the fluorometer. If the user clicks ‘Remove Cuvette’, it will depict an empty fluorometer like what we have seen in Figure 5.7.

Figure 5.10: Parameters Menu
If the user goes back to the Top Screen in Figure 5.3 and selects the monitor instead of the fluorometer we will be greeted with this page with three buttons on the top left corner. If the user selects ‘Return to Table’ it will return the user back to Figure 5.3.
If the user clicks on the ‘Parameters’ button, this menu will appear that asks the user to select certain parameters before performing the experiment and graphing the results.
Appendix A
In this section we will present the User Interface (UI) of our application. To obtain our images, we used a hash function to create unique names from the parameters. The function can be seen in Figure 5.11.

Figure 5.11: The hash function.